
Plan a concrete in LeRaysville borough, PA
This page is meant to get you from local planning context to a real mapped estimate. Review the data, then use the estimator to draw the actual concrete and choose the options that affect the range.
Estimate concrete cost in LeRaysville borough, PA
Use the calculator for quick numbers, then carry the details into the map estimator when you want the actual property layout, measurements, photos, and quote request packet.
This starts with LeRaysville borough, PA page-level context. Add an exact address or ZIP inside the calculator when you want tighter property-level location detail.
Concrete options
All concrete styles available for LeRaysville borough, PA planning
These match the style choices available in the estimator, so visitors can compare the full option set before drawing the project on the property map.
Planning note: These are the same option families available in the estimator.
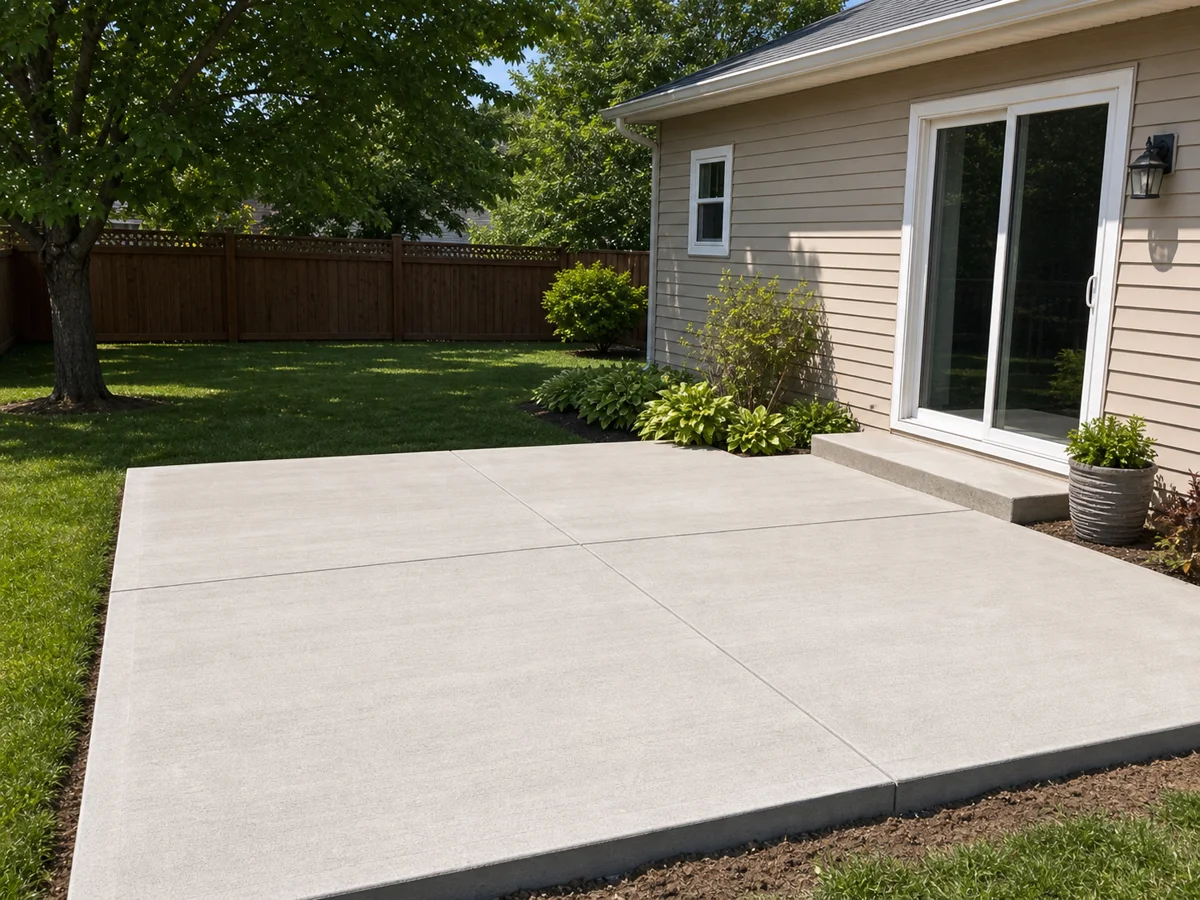
Broom-finished slab
Standard broom-finished concrete slab or pad planning range.
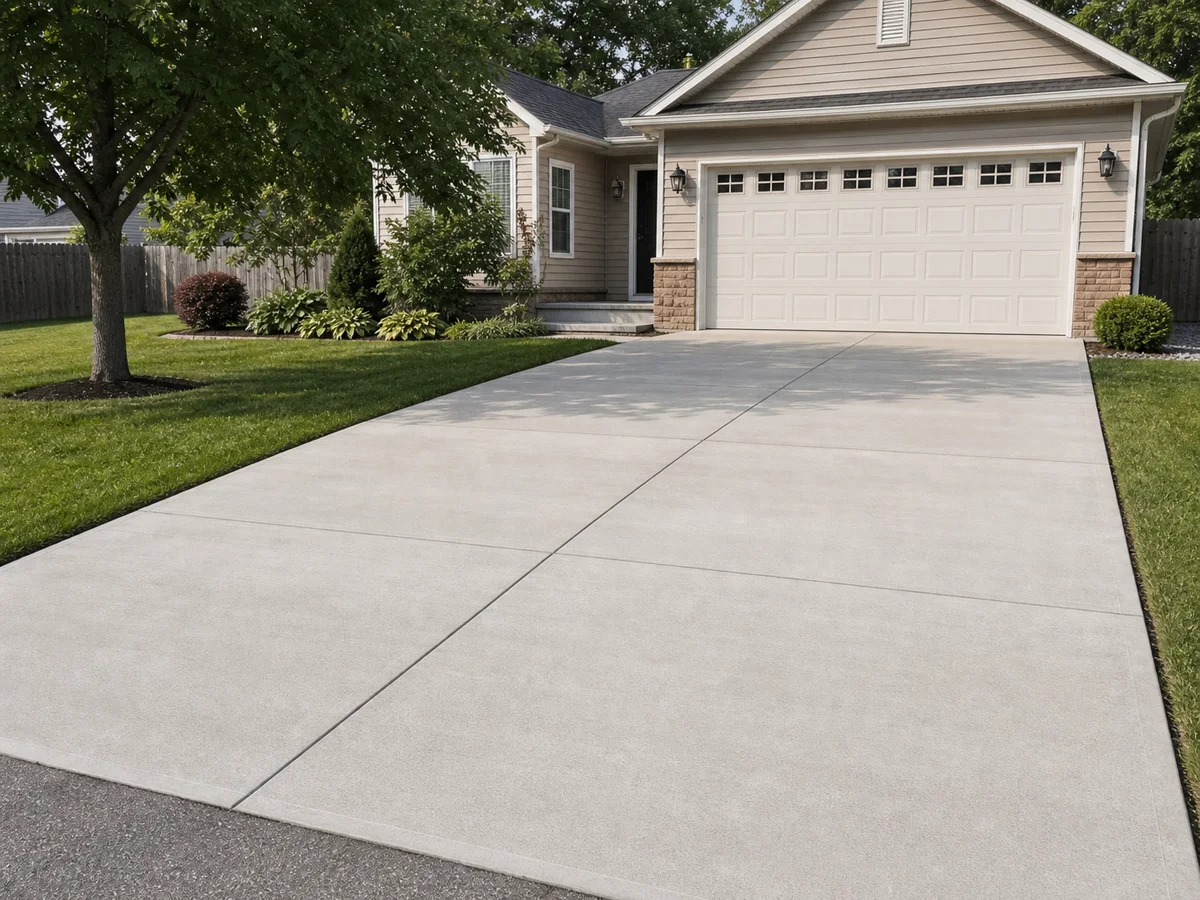
Concrete driveway
Residential driveway planning range with access, forms, base, and finish assumptions.
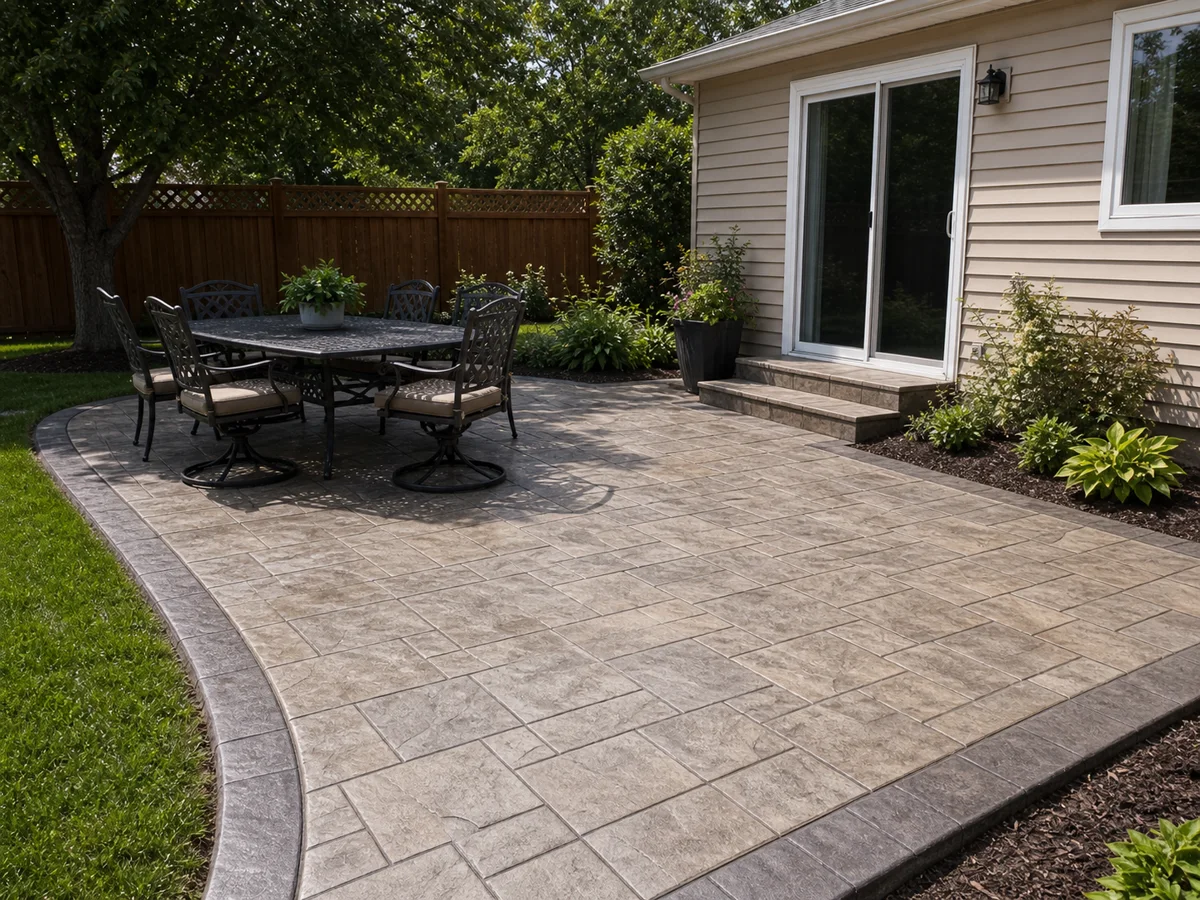
Stamped concrete
Decorative stamped concrete planning range with higher finish labor.
How the estimator works
From local research to a clearer concrete plan
- 01
Find the property
Open the satellite map and locate the driveway, side yard, backyard, or pad location.
- 02
Draw the footprint
Click around the concrete area and close the polygon to calculate square footage and perimeter.
- 03
Choose the finish
Compare broom-finished slabs, stamped concrete, driveways, and pads.
- 04
Add scope notes
Include demolition, reinforcement, base prep, drainage, access, and photos for contractors.
Local cost and contractor-market context
These signals help explain why planning prices can differ by area, but they work best after the estimator has the exact property layout and selected concrete options.
Planning note: Labor and contractor-market signals help explain local price pressure around LeRaysville borough, PA; exact scope still depends on the property layout and selected concrete options.
Labor signal
United States shows Cement Masons and Concrete Finishers wage context near $27 per hour.
County labor market
United States has 949,050 Construction establishments and 8,245,605 average employment, with average weekly pay near $1,631.
Regional cost level
Regional price parity context is loaded for United States with an index factor near 100%.
Construction activity
Permit activity shows 24,706 recent permits and a demand factor near 101%.
Concrete details that change the estimate
The local data helps explain cost pressure, but the price still depends on the exact project design. For concrete work, the highest-impact inputs usually include:
- square footage
- thickness
- reinforcement
- finish
- base prep
- demolition
- pump or truck access
- drainage
Weather, soil, and risk notes
Site conditions can affect prep, excavation, drainage, schedule, and review needs. Use these notes as reminders, then draw the property-specific scope so contractors can evaluate the real project.
Planning note: Soil context can point to excavation, footing, drainage, base-prep, or review questions.
Weather and climate
Available normals show 46.99 inches of precipitation and 63.8 inches of snowfall.
- heat, cold, rain, and freeze cycles affect placement windows and curing
- seasonal moisture can affect base prep and drainage details
Soil and base prep
USDA soil summary data has not been loaded for this area yet.
- clay, frost action, and poor drainage can increase base prep
- soft or expansive soils may need reinforcement or deeper prep discussion
Mapped hazard context
FEMA hazard context has not been loaded for this area yet.
What is intentionally not shown as local data
National material inflation is useful for admin pricing models, but it is not city-specific enough to present as a local-page signal. Broad city elevation and slope are also left out because grade can change dramatically across one parcel.
Use the estimator map for property-specific measurements, and use terrain or excavation tools inside the estimator where they apply. If you request quotes later, the mapped plan gives participating contractors more useful information to review.
Next step
Ready for a more specific concrete range?Start with the map and build the property plan so the local context and actual design can work together.