Avoid Permit Delays: Map Impervious Surface Calculation for Homeowners
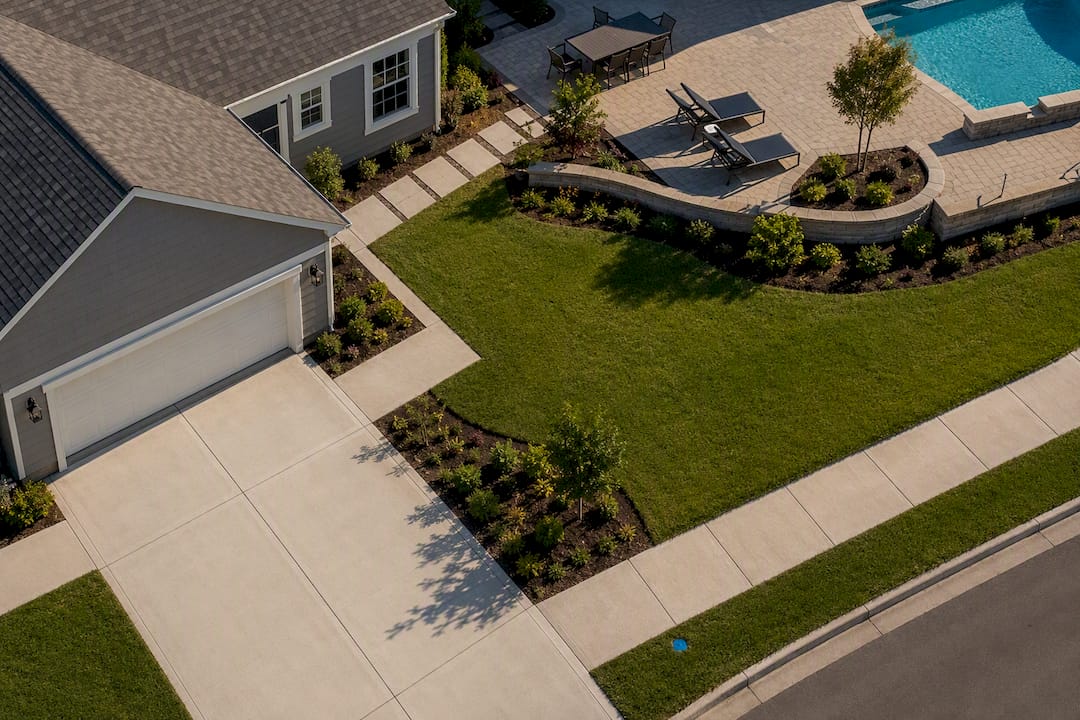
Impervious coverage equals total impervious area divided by lot area, multiplied by 100. Add up every roof, driveway, patio, and pool surface in square feet, divide by your total lot size, and you have your percentage. The fastest reliable path is either a municipal parcel map with a built-in measurement tool or a worksheet where you multiply length by width for each hard surface. Start by measuring your largest surfaces first: the roof and driveway usually decide whether you’re anywhere close to a limit.
TL;DR:
- Many cities cap impervious coverage between 25% and 40%, and exceeding this limit can delay permits or increase stormwater fees.
- Properly measuring all impervious surfaces, including roofs, driveways, patios, and pools, is essential, with municipal definitions varying for gravel and permeable materials.
- Satellite-based mapping tools can quickly estimate impervious area but are less accurate for small features, while certified surveys are required for precise documentation.
- Cumulative impervious additions over rolling periods can affect permit eligibility, requiring proper documentation of all past and planned developments.
- Using online project estimators and certified surveys helps plan costs and ensure compliance, but always verify your local impervious surface rules beforehand.
Table of Contents
- What counts as an impervious surface calculation
- Why the impervious area number actually matters
- Which surfaces to count (and which ones trip people up)
- Manual measurement, online tools, or GIS: picking the right method
- Step-by-step: building your impervious coverage worksheet
- A worked example: 10,000 square foot lot
- What municipal impervious limits usually look like
- How mapping tools like Property Improvement Estimator fit into the process
- What I’ve learned about impervious math that most guides skip
- Turn your measurements into a real project plan
- Sources
- FAQ
What counts as an impervious surface calculation
An impervious surface is any material that blocks water from soaking into the ground beneath it: roofing, concrete, asphalt, compacted gravel in many jurisdictions, and pool decking all qualify. Impervious coverage, sometimes called lot coverage, is the percentage of your total lot area that these surfaces occupy. The EPA defines impervious cover as anything that prevents or significantly slows infiltration, which is why the term shows up in stormwater regulations as often as it does in zoning code.
Most calculations count the full footprint of a structure, including the roof’s drip line, not just the building’s foundation walls. A patio, a pool deck, a paved driveway, and a concrete walkway all get added to the tally. Where things get murky is with materials like compacted gravel or permeable pavers: some cities count gravel as impervious once it’s been driven on and compacted for years, while others exempt it entirely if it’s properly drained. That variation is why you should never assume your city treats a surface the same way a neighboring county does. Pull your specific municipal definition before you finalize any number, especially if a permit hinges on it.
Why the impervious area number actually matters
Cities cap how much of a lot can be covered with impervious surfaces because runoff volume rises almost directly with paved area, and that runoff has to go somewhere. Exceed your lot’s allowed percentage and a building permit gets denied or delayed until you redesign, shrink the driveway, or add a drainage feature to offset the difference.
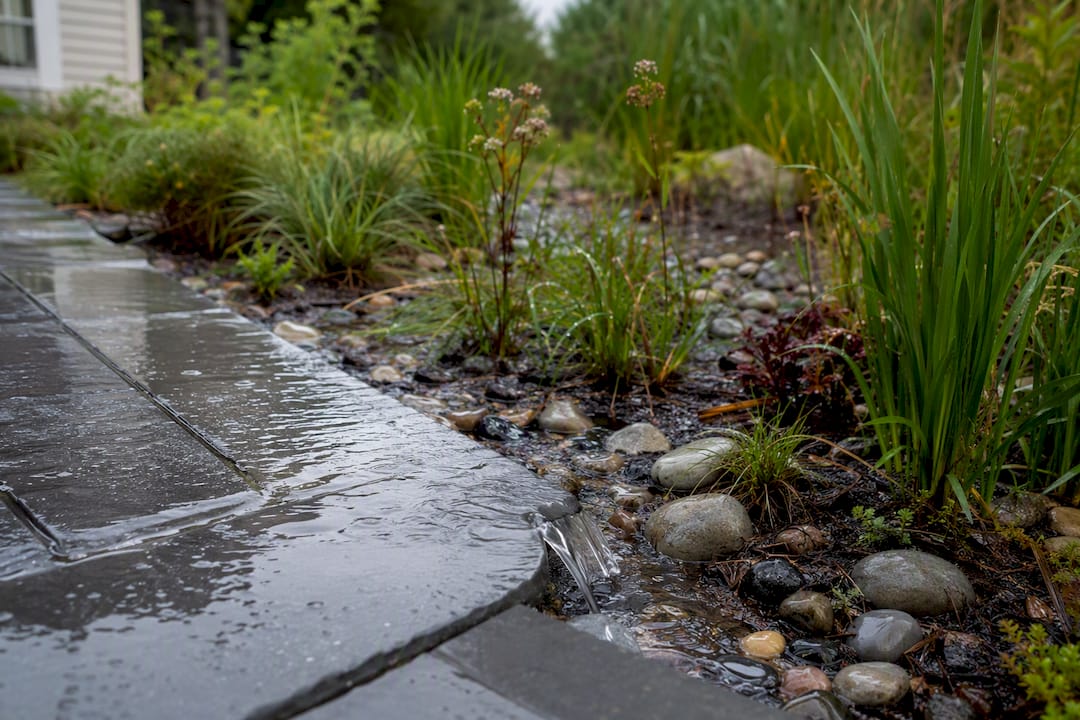
Many cities also charge stormwater utility fees scaled to a property’s impervious footprint. The City of Raleigh publishes an interactive impervious surface map specifically so property owners can check the number their fee is based on, which tells you how directly this calculation ties to your utility bill. Beyond fees and permits, tracking impervious area helps you size any drainage or green infrastructure correctly. Undersize a French drain or rain garden because you underestimated your paved footprint, and you’ll be dealing with standing water after the next storm.
Which surfaces to count (and which ones trip people up)
Some surfaces are impervious in every code book. Others depend entirely on your jurisdiction, and getting this wrong is the single most common reason a homeowner’s self-calculated percentage doesn’t match what the building department comes back with.
Always count these:
- Roof footprint, measured to the drip line, not the foundation
- Concrete or asphalt driveways and parking areas
- Patios, walkways, and pool decking
- The pool’s water surface area itself
- Any structure with a solid, impermeable roof (sheds, carports, covered porches)
Conditionally counted, depending on your municipality:
- Compacted gravel driveways and parking pads
- Interlocking or impermeable pavers
- Decks, especially if the surface below them can’t drain (solid decking over a slab counts differently than open slat decking over grass)
Usually pervious, but verify locally:
- Lawns, mulched beds, and planted landscaping
- Loose, uncompacted gravel over a permeable base
- Some certified permeable paver systems
Pro Tip: Before you total anything, call or check your building department’s website for their specific impervious-surface definition. A ten-minute phone call can save you from redesigning a driveway after your permit application gets kicked back.
Manual measurement, online tools, or GIS: picking the right method
Your accuracy needs and your timeline should decide which method you use, not the other way around.
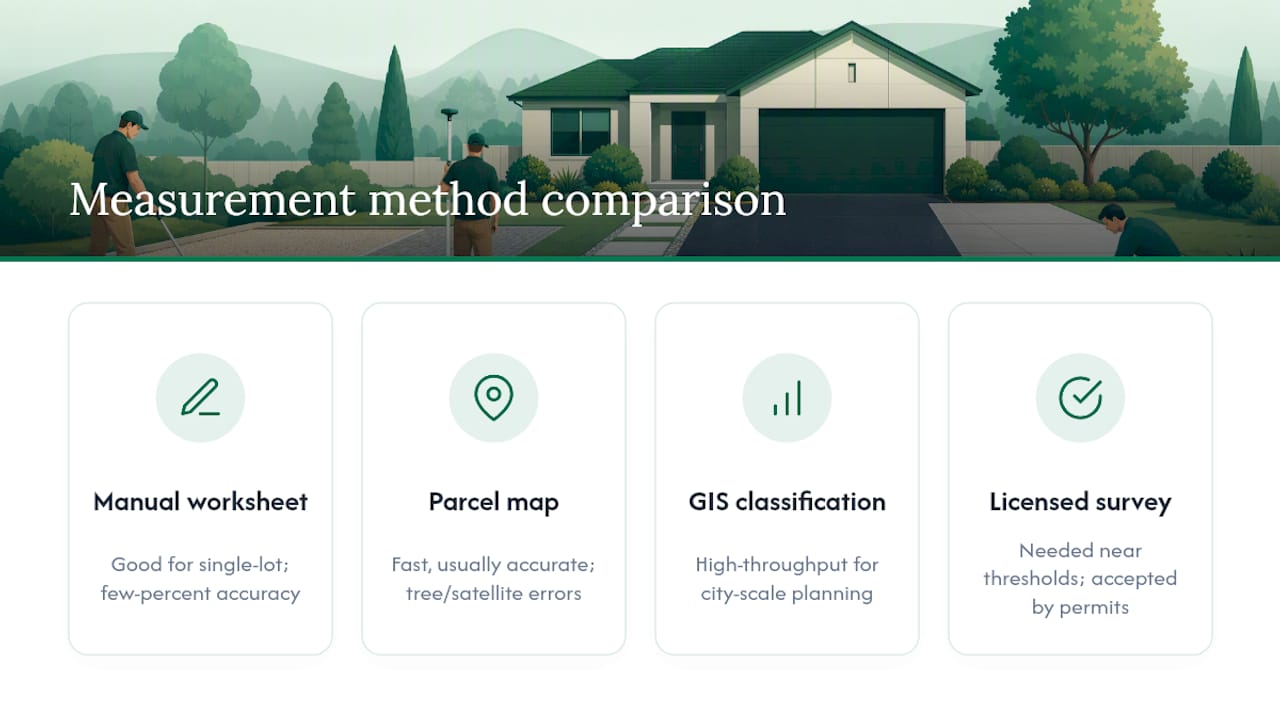
A manual worksheet works fine for a single-lot homeowner project. You walk the property with a tape measure or laser distance tool, record length and width for each hard surface, and do the arithmetic yourself. Accuracy typically runs within a few percent of a certified survey, which is plenty for planning purposes, though not always enough for a contested permit review.
Parcel maps and online measurement tools split the difference between speed and precision. Most counties now publish GIS parcel viewers where you can trace a polygon over a satellite image and get an instant area readout. These tools are faster than manual measurement and usually accurate enough for a first-pass estimate, though satellite imagery resolution and tree canopy cover can introduce errors on smaller features like narrow walkways.
GIS and spectral imagery classification is the heavyweight option. Municipalities and planners use tools like the workflow Esri documents for classifying spectral imagery to calculate impervious surface across hundreds or thousands of parcels at once. That level of processing makes sense for a city doing a stormwater master plan. It’s overkill for a homeowner adding a patio.
Hire a licensed surveyor when your project sits close to a permit threshold, when a neighbor dispute involves your lot line, or when the building department explicitly requires certified documentation. Surveyed data holds up in a way that a self-measured worksheet doesn’t, and some jurisdictions won’t accept anything else for final permit approval.
Step-by-step: building your impervious coverage worksheet
Municipal worksheets, like the one Chisago County publishes, follow the same basic structure everywhere. Here’s how to fill one out correctly.
- Find your total lot area. Pull this from your property deed, county assessor’s records, or a parcel map viewer. Note the source in your worksheet.
- List every impervious feature on the lot. House footprint, garage, driveway, patio, pool, deck, shed, walkway. Don’t skip small items like an AC pad or a utility shed.
- Measure each feature. For rectangular shapes, record length times width in feet. For irregular shapes, trace the polygon in a mapping tool and record the area it returns, or break the shape into rectangles and triangles you can measure by hand.
- Sum all impervious areas into one total, in square feet.
- Divide the total by lot area, then multiply by 100. That’s your impervious coverage percentage.
- Document your sources. Note whether each measurement came from a field tape measure, a parcel map, or a certified survey, and add your name and date if the worksheet is going to a building department.
| Worksheet field | What to enter |
|---|---|
| Lot area | Total square footage from deed or assessor record |
| Impervious feature list | Every hard surface, one row each |
| Measurement method | Field measurement, map tool, or survey |
| Total impervious area | Sum of all feature rows |
| Impervious coverage % | (Total impervious ÷ lot area) × 100 |
| Preparer / date | Name and date for permit submittal |
Keep a copy of your source measurements attached to the worksheet. If a building department questions a number six months later, you want to be able to show exactly how you got it.
A worked example: 10,000 square foot lot
Here’s how the math plays out on a typical suburban lot.
Divide 3,310 by the 10,000 square foot lot, multiply by 100, and you land at 33.1% impervious coverage.
The number to watch: residential lot coverage limits commonly fall between 25% and 40%, so this hypothetical lot sits mid-range, close enough to a common cap that adding a second shed or expanding the patio could push it over a 35% threshold in some cities.
That’s the practical value of doing this math before you build, not after.
What municipal impervious limits usually look like
Some ordinances also grant bonus coverage percentage when a project includes green infrastructure or permeable paving, incentives that several municipalities are expanding as part of broader flood resilience planning.
A detail that catches a lot of homeowners off guard: many jurisdictions track cumulative impervious additions over a rolling period, sometimes 24 months, rather than looking at each project in isolation. Add a shed this year and a patio extension next year, and a building department may add both together against your limit even though you never filed for a single project that large.
Documentation requirements typically include:
- A plot plan or site survey showing all existing and proposed impervious features
- A completed impervious surface worksheet with measurements and sources
- Prior permit history for the property, since some departments check for cumulative additions
Confirm your city’s exact percentage cap and lookback period before finalizing project plans. This is where a phone call to the building department saves real money.
How mapping tools like Property Improvement Estimator fit into the process
Drawing your project directly on aerial imagery turns a rough guess into a real measurement. Some online platforms let you sketch a driveway, patio, pool, or deck footprint on a satellite view of your property and calculate the area automatically instead of leaving you to eyeball it.
- Draft measurements this way before committing to a design, so you catch a coverage problem before you’re mid-permit
- Feed the same footprint into a project calculator, like the Pool Estimate Calculator, to see cost alongside area
- Use the drawing as a starting point for contractor conversations, not as a final permit document
Pro Tip: A map-based drawing is excellent for planning and contractor quotes. It is not a substitute for a certified survey once a permit application requires signed documentation.
What I’ve learned about impervious math that most guides skip
Track cumulative changes, not just the current project. A shed two years ago and a patio today can combine against your limit even if neither one alone would have. Use map-based drafts to plan fast, but expect a surveyed plan for the actual permit. And always ask whether your city counts decks, pools, or compacted gravel before you assume they don’t.
— Christian
Turn your measurements into a real project plan
Once you’ve got your impervious percentage figured out, the next question is usually: what will the project actually cost, and who’s going to build it? Propertyimprovementestimator is built for exactly that handoff. Draw your driveway, patio, pool, or deck directly on aerial imagery of your lot to get a site-specific estimate using local cost data, with no account required.

The workflow is simple: sketch your project on the map, run it through the relevant calculator, like the Asphalt Cost Calculator for a driveway or the Deck Cost Calculator for a deck, and request quotes with your exact measurements already attached. If drainage is part of your plan, drainage channel guidance is worth a look before you finalize a patio layout. When your project is ready for a permit application, get a certified survey to back up the numbers. But for planning, budgeting, and getting contractors real dimensions instead of guesses, start a local project report and see what your property looks like on the map.
Sources
- Impervious Surface (City of Raleigh)
- Soak up the Rain: Rain Gardens (EPA)
- Impervious Surface Calculation Worksheet (Chisago County)
FAQ
How do you compute impervious surface area?
Measure the square footage of every hard surface on your lot, roof, driveway, patio, pool, and walkways, then add them together. That sum is your total impervious area, which you’ll use to calculate your coverage percentage.
How do you figure out impervious coverage percentage?
Divide your total impervious area by your total lot area, then multiply by 100. A 10,000 square foot lot with 3,310 square feet of hard surfaces comes out to 33.1% coverage, right in the common residential range of 25% to 40%.
How do you calculate square footage for a driveway or patio?
Multiply length by width for rectangular sections, in feet, to get square feet. For irregular shapes, trace the outline in a parcel map tool or an estimator like Propertyimprovementestimator, which calculates the polygon area automatically from your drawing.
What surfaces are considered impervious?
Roofs, concrete and asphalt, patios, pool decking, and paved parking areas are impervious almost everywhere. Compacted gravel and certain deck types are impervious in some jurisdictions and pervious in others, so confirm the specific rule with your building department before finalizing a calculation.